

Environmental Pollution and Associated Hazards – UPSC Agriculture Optional
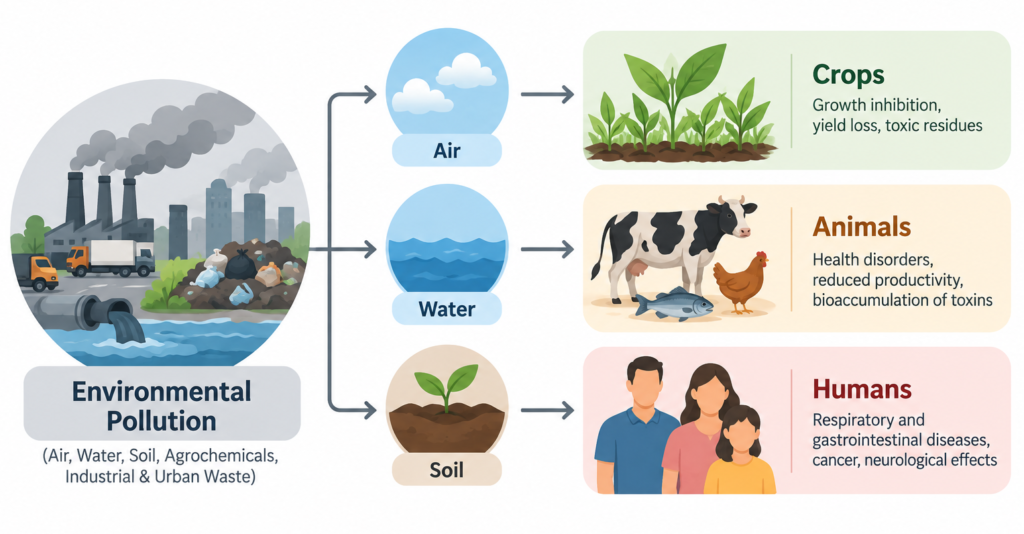
In agricultural ecology and environmental geography, environmental pollution represents the anthropogenic distortion of the biophysical matrix (atmosphere, hydrosphere, and rhizosphere). This distortion breaches ecological carrying capacities, shifting highly productive landscapes into degraded states.
For a UPSC Agriculture Optional candidate, environmental pollution must be evaluated not merely as an urban-industrial crisis, but as a critical biophysical barrier that alters physiological pathways in crops, disrupts metabolic stability in livestock, and accelerates chronic non-communicable disease burdens in human populations.
1. Advanced Structural Classification of Pollutants
Evaluating environmental degradation requires classifying toxic agents based on their structural persistence, natural existence, and ecological trajectory:
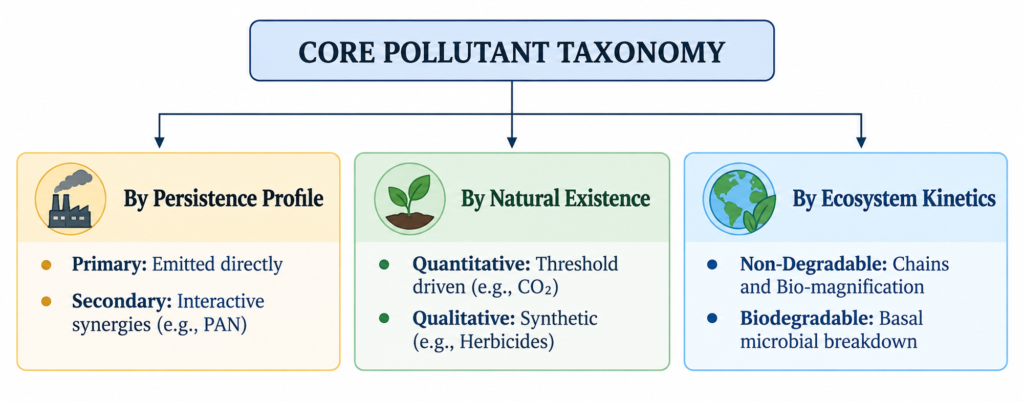
I. By Structural Form and Persistence Post-Release
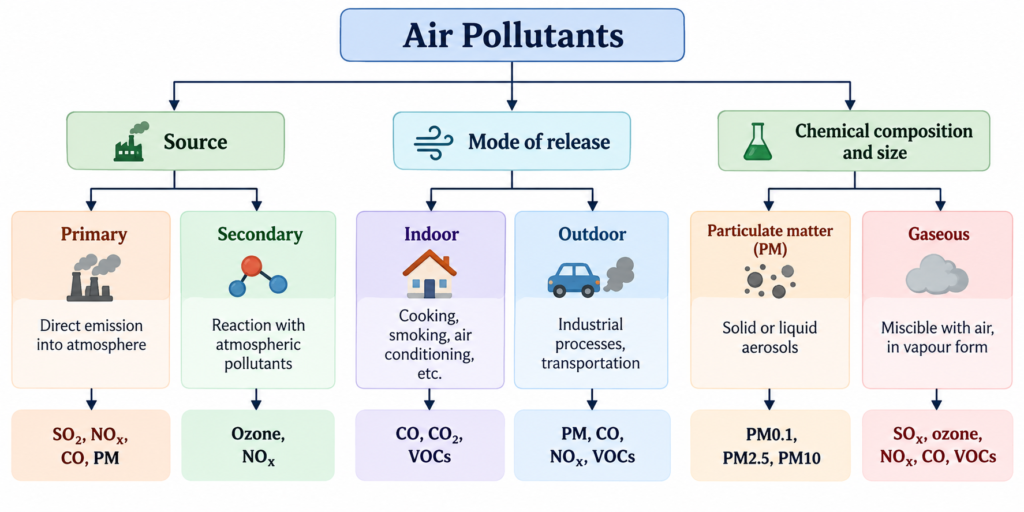
- Primary Pollutants: These enter the environment directly from identifiable sources and persist in the exact chemical form in which they were emitted.
- Examples: DDT, structural plastics, Carbon Monoxide (CO), Carbon Dioxide (CO2), and primary oxides of nitrogen (NOx), and sulfur (SOx) from fossil fuel combustion and crop residue burning.
- Secondary Pollutants: Formed through complex photochemical or chemical interactions among primary pollutants within the atmospheric column.
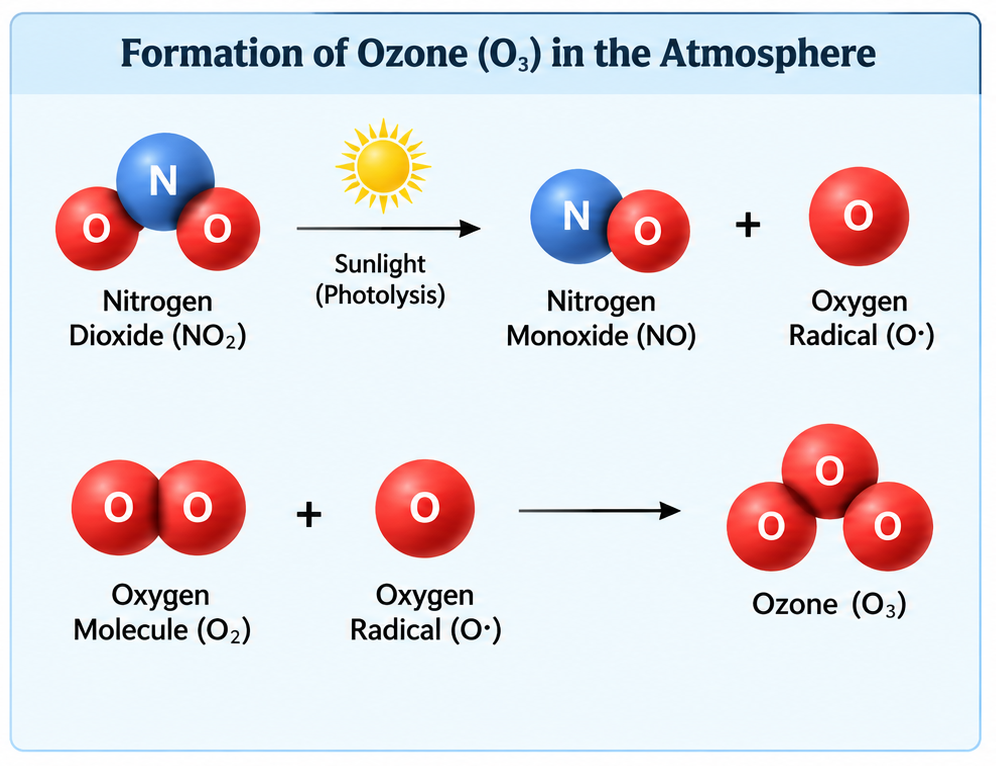
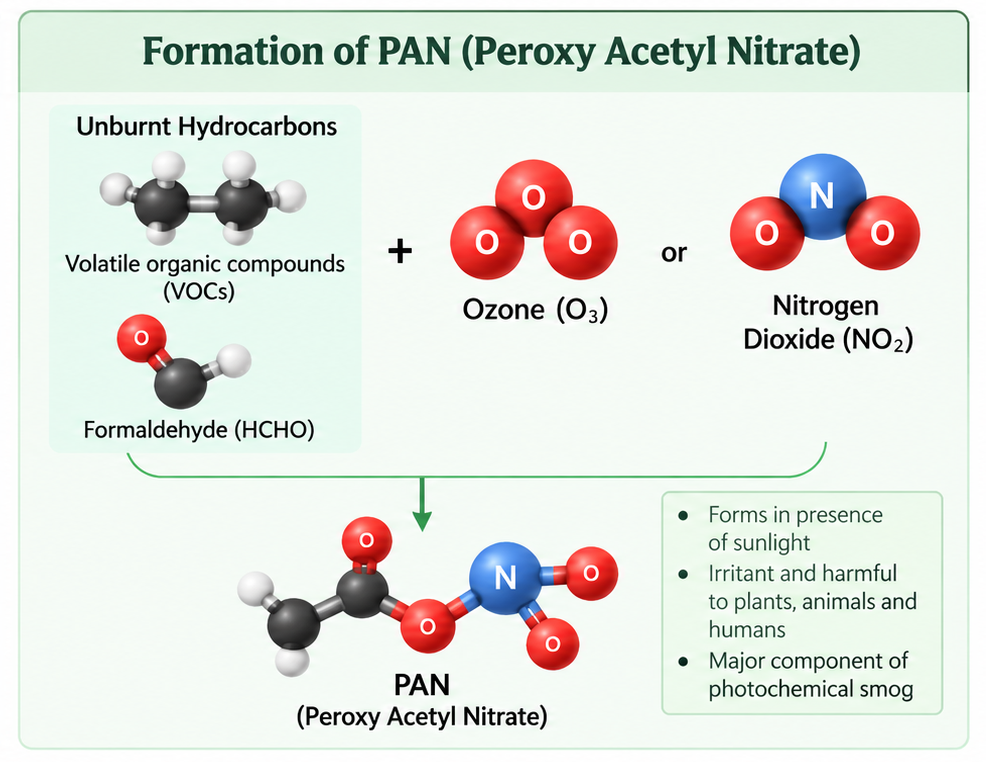
- Example: Peroxyacetyl Nitrate (PAN) and ground-level Ozone (O3) synthesized via solar-driven reactions between volatile organic compounds (VOCs) and nitrogen oxides. PAN severely restricts cellular energy generation by destroying chlorophyll membranes.
II. By Background Existence in Nature
- Quantitative Pollutants: Substances that occur naturally in the biosphere but acquire toxic properties when their concentration breaches a specific, safe threshold level.
- Examples: Carbon Dioxide (CO2) and Nitrogen Oxide (NO) . Normal baseline levels support photosynthesis and nitrogen cycles, but excessive spikes trigger global warming and photochemical smog.
- Qualitative Pollutants: Purely human-made, synthetic compounds that do not exist naturally in the biosphere.
- Examples: Synthetic fungicides, chemical herbicides (e.g., Glyphosate), and organochlorine insecticides like DDT. These present severe eco-toxic risks because ecosystems lack evolutionary metabolic pathways to degrade them safely.
III. By Ecosystem Kinetics and Bio-Degradability
- Non-Degradable Pollutants: Heavy molecules and elements that cannot be broken down or detoxified by natural microbial pathways.
- Ecosystem Trajectory: They accumulate in the abiotic environment and undergo Biological Magnification (Bio-magnification). As these stable, lipophilic toxins pass through sequential trophic tiers in an unchanged state, their relative tissue concentration scales exponentially, severely poisoning top-tier predators and human populations.
- Biodegradable Pollutants: Organic materials that can be broken down, recycled, and returned to mineral pools through standard microbial action, provided the volume does not overwhelm local carrying capacities.
2. Air Pollution Metrics: A Global Public Health Crisis
Atmospheric pollution is the world’s single greatest environmental risk to health, causing roughly 7 million premature deaths annually worldwide.
The State of Global Air (SoGA) Analytical Imperatives
The data-driven evidence provided by the Health Effects Institute (HEI) highlights severe geographic exposure trends:
- The Leading Risk Vector: Air pollution ranks as a top-tier risk factor for global mortality, placing an immense burden on newborns and driving widespread neonatal health complications.
- The South Asian Hotspot: India, Bangladesh, Pakistan, and Nepal rank among the top global territories for extreme PM2.5 (Fine Particulate Matter) exposure. Outdoor PM2.5 densities in these nations scaled up systematically between 2010 and 2019.
- The Ozone (O3) Surge: India experiences immense ground-level Ozone (O3) exposure. Among the world’s most populous nations, India has recorded a sharp 17% increase in O3 concentrations over a ten-year tracking window.
- The Indian Mortality Burden: Prolonged exposure to ambient outdoor and indoor household air pollution contributes to over 1.67 million annual deaths in India. These premature fatalities are driven by non-communicable diseases (NCDs), including stroke, myocardial infarction (heart attacks), type-2 diabetes, lung cancer, chronic obstructive pulmonary disease (COPD), and neonatal diseases.
3. Associated Hazards of Air Pollution across Biological Frontiers
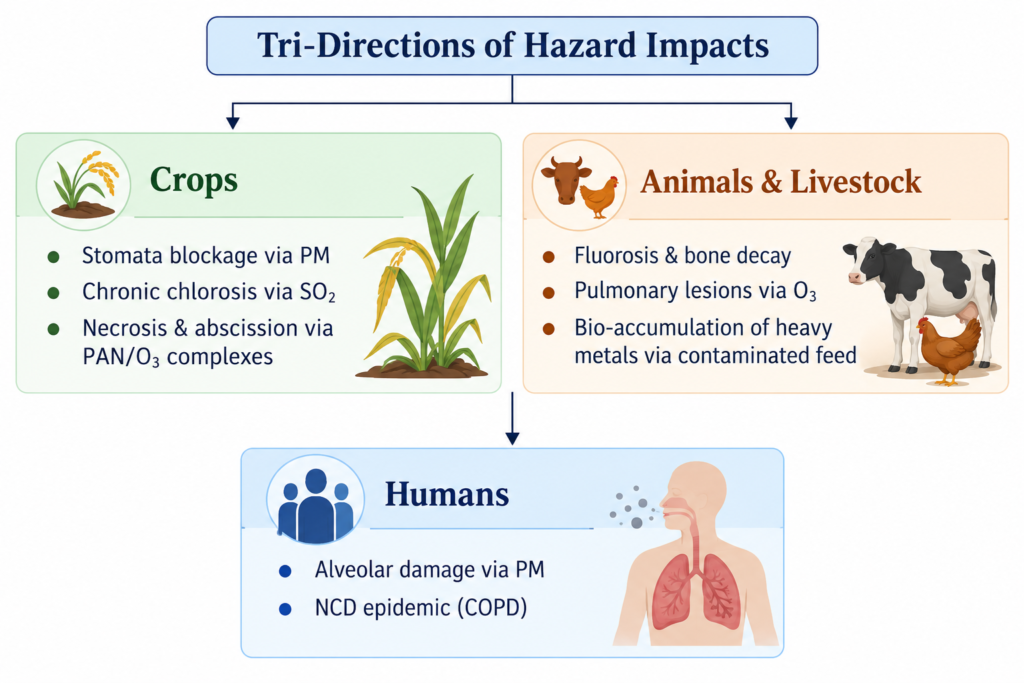
I. Impact Matrix on Crops and Vegetation
Air pollutants cause structural damage to plant canopies, disrupting core metabolic pathways:
- Particulate Matter (PM2.5/PM10) : Fine dusts settle on the leaf lamina, physically blocking stomatal pores. This obstruction prevents essential gas exchange (CO2 intake) and disrupts transpirational water currents.
- Sulphur Dioxide (SO2) : Competes directly with CO2 for binding sites on photosynthetic enzymes, stalling carbon assimilation.
- Acute Exposure: Triggers localized necrotic blotching (dead tissue patches) on broad-leaved crops.
- Chronic Exposure: Retards chlorophyll production, leading to gradual chlorosis (yellowing of leaves) and reduced economic yields.Nitrogen Oxenses
- Nitrogen Oxenses (NOx): Induce structural mutations like epinasty (downward bending of leaves) and accelerate abscission (premature dropping of leaves and flowers).
- Ground-Level Ozone (O3): Acts as a highly aggressive oxidant. It enters stomatal cavities and generates reactive oxygen species (ROS) that destroy plant cells, causing leaf flecking and premature canopy death.
II. Impact Matrix on Domesticated Livestock and Wildlife
Animals exhibit severe physiological distress when exposed to highly contaminated air sheds:
- Ingestion Toxins: Atmospheric particulates carrying heavy metals (Lead, Cadmium, Arsenic) settle onto green pastures. When grazed by cattle, these toxins trigger severe heavy metal poisoning, which alters reproductive cycles and lowers milk yields.
- Fluoride Poisoning (Industrial Fluorosis): Livestock grazing near aluminium smelters ingest forage covered in airborne fluorides. This exposure leads to chronic fluorosis, causing teeth to blacken, bones to weaken, and joints to stiffen.
- Respiratory Pathologies: High concentrations of ambient ozone tear through mucosal linings in livestock lungs, causing deep pulmonary edema, chronic lesions, and a weakened immune system that leaves herds highly vulnerable to secondary bacterial infections.
III. Impact Matrix on Human Health
The human respiratory and cardiovascular architecture faces severe stress from systemic air pollution:
- Deep Alveolar Penetration: PM2.5 particles bypass upper airway filtration mechanisms and travel deep into the lung alveoli. From there, they cross the blood-air barrier, triggering chronic vascular inflammation, blood clot risks, and cellular damage.
- Carcinogenic Vulnerabilities: Industrial emissions contain highly volatile organic compounds (VOCs) and polycyclic aromatic hydrocarbons (such as Benzopyrene). These compounds act as potent carcinogens, directly altering cellular DNA and accelerating lung and bladder cancers.
Major Gaseous Air Pollutants: Carbon Monoxide (CO) – UPSC Agriculture Optional
In agricultural meteorology and environmental toxicology, understanding the specific behavior, chemical properties, and physiological impacts of gaseous pollutants is vital. Among these, Carbon Monoxide (CO) acts as a major atmospheric contaminant that impacts biological pathways, alters local microclimates, and poses immediate threats to human and animal welfare.
1. Physico-Chemical Properties and Environmental Lifespan
Carbon Monoxide possesses distinct molecular characteristics that dictate its distribution kinetics and toxicity profile within the biophysical matrix:
- Physical State: It is a colourless, odourless, and tasteless gas, making its detection impossible through baseline human or animal sensory perception.
- Vapour Density: CO is slightly less dense than ambient air (having a molecular weight of 28 g/mol compared to the ~28.97 g/mol average of dry air), allowing it to mix rapidly and diffuse within the lower troposphere.
- Atmospheric Residence Time: It is relatively short-lived, maintaining an atmospheric residence lifespan of only a few months. Over time, it is oxidized via hydroxyl radicals (OH.) or chemical oxidation into Carbon Dioxide (CO2)
- Combustion Kinetics: In the presence of sufficient oxygen and an ignition source, Carbon Monoxide burns with a characteristic blue flame, undergoing complete oxidation to form Carbon Dioxide:
2. Anthropogenic and Agrarian Sources of Carbon Monoxide
Carbon Monoxide accumulates primarily through incomplete thermal combustion loops where oxygen behaves as a limiting reagent:
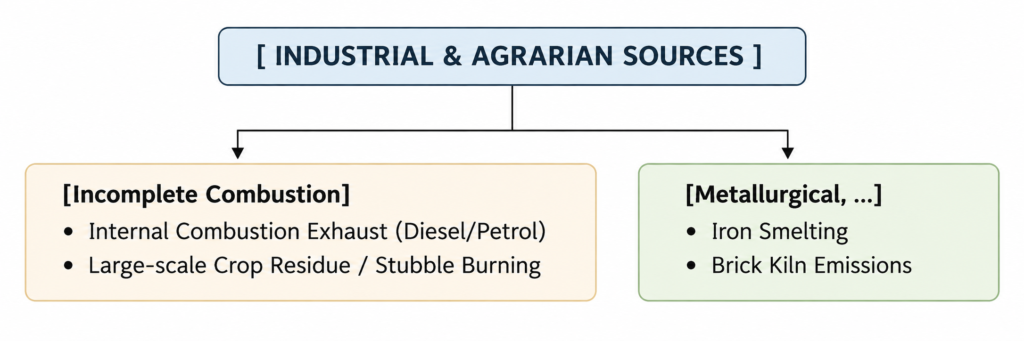
- Exhaust Emissions: The primary source remains the tailpipe exhaust of internal combustion engines operating under rich air-fuel ratios, where air supply is insufficient to fully oxidize the carbon skeleton into CO2.
- Crop Residue and Stubble Burning: In agrarian landscapes (specifically the Indo-Gangetic Plains during the Kharif-Rabi transition), the incomplete open-field combustion of massive crop residues (e.g., paddy straw) generates heavy seasonal plumes of CO.
- Metallurgical By-products: Iron smelting and blast furnace operations release immense volumes of Carbon Monoxide as a direct chemical by-product during the reduction of iron ore via coke.
3. Associated Hazards Across Biological Systems
While CO does not cause immediate structural tissue destruction on plant leaves like SO2 or Ozone, it induces deep systemic damage across biological systems:
I. Impact on Human and Animal Physiology
The primary hazard of Carbon Monoxide is its high affinity for oxygen-carrying metalloproteins:
- The Carboxyhaemoglobin Matrix: When inhaled, CO diffuses across the pulmonary alveoli and binds with hemoglobin in the bloodstream. Its chemical affinity for hemoglobin is roughly 200 to 250 times greater than that of Oxygen (O2)
- Cellular Hypoxia: This structural binding forms a highly stable complex known as Carboxyhaemoglobin (COHb). The formation of COHb alters the structural conformation of the hemoglobin molecule, blocking the binding sites for oxygen and preventing oxygen delivery to vital tissues. This induces severe cellular hypoxia (oxygen starvation).
- Clinical Fallout: In humans and livestock, chronic exposure leads to headaches, dizziness, and reduced cognitive/motor functions. Acute exposure triggers respiratory failure, cardiovascular arrest, and asphyxiation. Pregnant livestock exposed to CO experience high rates of abortion and neonatal mortality due to fetal hypoxia.
II. Secondary Impacts on Crop Systems and Ecology
- Suppression of Nitrogen Fixation: High localized concentrations of atmospheric CO can inhibit Biological Nitrogen Fixation (BNF) in legumes. The gas competes with dinitrogen (N2) by binding irreversibly to the iron-molybdenum cofactor of the nitrogenase enzyme in Rhizobium root nodules, reducing nitrogen assimilation.
- Tropospheric Ozone Catalyst: As CO oxidizes in the troposphere via reactions with hydroxyl radicals, it initiates chemical pathways that generate secondary pollutants, including ground-level Ozon (O3), which directly causes leaf necrosis and
Structural Matrix of Phytotoxic Damage
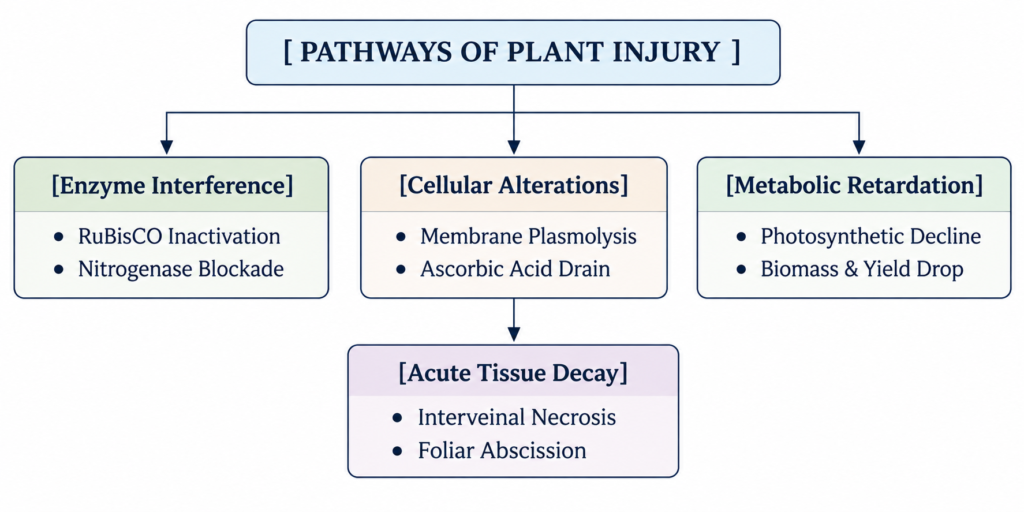
I. Interference with Enzyme Systems
- Photosynthetic Enzyme Suppression: Oxidants like (O3) generate reactive oxygen species (ROS) that oxidize and deactivate RuBisCO, stalling the Calvin cycle.
- Respiration Pathway Disruptions: Gases like and competitively bind to Cytochrome c Oxidase, blocking mitochondrial electron transport and halting ATP production.
- Nitrogen Metabolism Blockade: Cellular absorption of generates sulfite
II. Change in Cellular Chemical Constituents and Physical Structure
- Membrane Peroxidation and Plasmolysis: Photochemical oxidants like PAN and ground-level O3 trigger lipid peroxidation of the plasma membrane, destroying membrane semi-permeability and causing cell leakage.
- Degradation of Plastid Pigments: Acid-forming gases (SO2) react with leaf moisture to strip magnesium (MG2+) from chlorophyll, converting it into pheophytin and inducing widespread chlorosis (yellowing).
- Antioxidant System Depletion: Cellular stress drains internal reserves of Ascorbic Acid (Vitamin C) and glutathione, leading to a collapse of homeostatic cellular defense.
III. Retardation of Growth and Reduced Production Due to Metabolic Changes
- Suppression of Net Photosynthetic Rate: Chlorophyll destruction and stomatal closure lower the plant’s Net Assimilation Rate (NAR), forcing it to divert energy to repair instead of expanding its leaf area.
- Altered Assimilate Partitioning: Pollutants block phloem loading mechanisms, preventing the transport of carbohydrates to root sinks, which results in stunted root networks and lowered nutrient uptake.
- Yield Compression: Metabolic stress in major staples like Triticum aestivum (wheat) and Oryza sativa (rice) decreases productive tillering and shortens grain filling, cutting economic yield.
IV. Acute, Immediate Tissue Degeneration
- Interveinal Foliar Necrosis: High SO2 concentrations destroy the palisade parenchyma, triggering acute interveinal necrosis (ivory-white or brown dead tissue zones).
- Foliar Flecking and Glazing: Ambient O3 causes dark necrotic flecks on upper leaf surfaces, while PAN breaks down the spongy mesophyll, creating a unique silver-glazing pattern on lower surfaces.
- Abscission and Canopy Collapse: Systemic injury triggers spikes in stress ethylene, which forms abscission layers at the base of petioles and leads to premature defoliation and reproductive drop.
Prevention and Control of Air Pollution – UPSC Agriculture Optional
Mitigating atmospheric degradation requires a combination of industrial engineering, strict automotive standards, and robust statutory monitoring frameworks. For an Agriculture Optional candidate, controlling air pollution is essential to protect the rural microclimate, eliminate phytotoxic injuries to crops, and prevent respiratory diseases in livestock and human populations.
1. Industrial Pollution Abatement Strategies
Industrial manufacturing, power generation, and agro-processing units must implement engineering interventions to lower their emissions footprint:
- Cleaner Fuel Transitions: Replacing high-sulfur coal or heavy fuel oils with cleaner alternatives like Liquified Natural Gas (LNG) in fertilizer plants and thermal power stations. This transition is economically viable and significantly reduces emissions of oxides of sulfur (SOx) and nitrogen (NOx).
- End-of-Pipe Technological Interventions:
- Electrostatic Precipitators (ESPs) and Fabric Filters: Installed in industrial chimneys to capture over 99% of fly ash and particulate matter (PM10/PM2.5) using high-voltage electrostatic charges.
- Catalytic Converters: Utilizing noble metal catalysts (platinum, palladium, rhodium) to oxidize toxic Carbon Monoxide (CO) into CO2 and reduce NOx into inert dinitrogen (N2)
- Structural and Spatial Relocation: Increasing chimney heights to enhance the atmospheric dispersion of gases, along with shifting highly polluting industries away from urban centers and agricultural clusters.
- Green Belt Development: Establishing and maintaining wide biological green belts featuring pollution-tolerant tree species (e.g., Azadirachta indica, Pongamia pinnata). These belts act as natural sinks to filter particulates and absorb gaseous contaminants.
2. Vehicle Emission Controls: Bharat Stage (BS) Norms
Instituted in 2000, the Bharat Stage (BS) emission standards are progressive regulatory metrics modeled after European standards (Euro norms) to control vehicular emissions.
Chronological and Technical Transitions
- BS-IV vs. BS-VI Core Difference: The primary distinction lies in the sulfur concentration allowed in automotive fuel. BS-IV fuel permitted up to 50 ppm of sulfur, whereas BS-VI grade fuel restricts it to a maximum of 10 ppm.
- Impact of BS-VI on Emissions:
- Reduces Particulate Matter (PM) emissions in diesel cars by 80%.
- Lowers Nitrogen Oxides (NOx) emissions by 70% in diesel vehicles and 25% in petrol vehicles.
- Corporate Average Fuel Efficiency (CAFE-2) & BS-VI Stage-II: Implemented to target aggregate fleet emissions. BS-VI Stage-II made On-Board Diagnostics (OBD) mandatory alongside Real Driving Emissions (RDE) monitoring, which measures emissions under actual on-road driving conditions rather than artificial test laboratory cycles.
3. Regulatory Assessment and Monitoring Frameworks
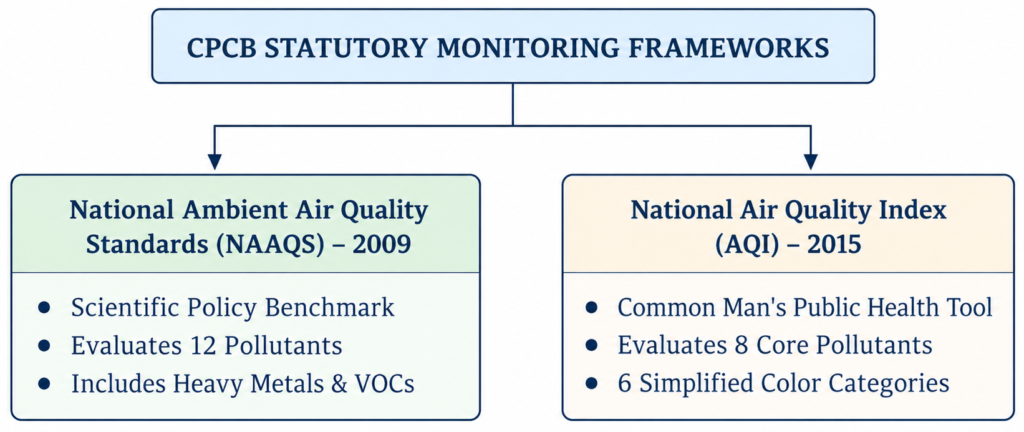
The Government of India monitors ambient air quality nationwide through two distinct regulatory frameworks managed by the Central Pollution Control Board (CPCB) under the statutory mandate of the Air (Prevention and Control of Pollution) Act, 1981.
I. National Ambient Air Quality Standards (NAAQS)
Revised in November 2009, NAAQS serves as the scientific and legal baseline for ambient air quality evaluation nationwide. It tracks 12 distinct pollutants, including heavy metals and volatile organic compounds (VOCs):
- Criteria Gases: Sulfur Dioxide (SO2), Nitrogen Dioxide (NO2), Ozone (O3), Carbon Monoxide (CO), and Ammonia (NH3).
- Particulates: PM10 and PM2.5.
- Heavy Metals: Lead (Pb), Arsenic (As) , and Nickel (Ni).
- Organic Pollutants / VOCs: Benzene and Benzopyrene.
II. National Air Quality Index (AQI)
Launched in April 2015 as a public information initiative under the Swachh Bharat Mission, the AQI simplifies complex environmental data into a single numerical index that helps the public gauge local air quality.
- The 8-Pollutant Matrix: Unlike the comprehensive 12-pollutant NAAQS array, the AQI evaluates exactly eight key pollutants:
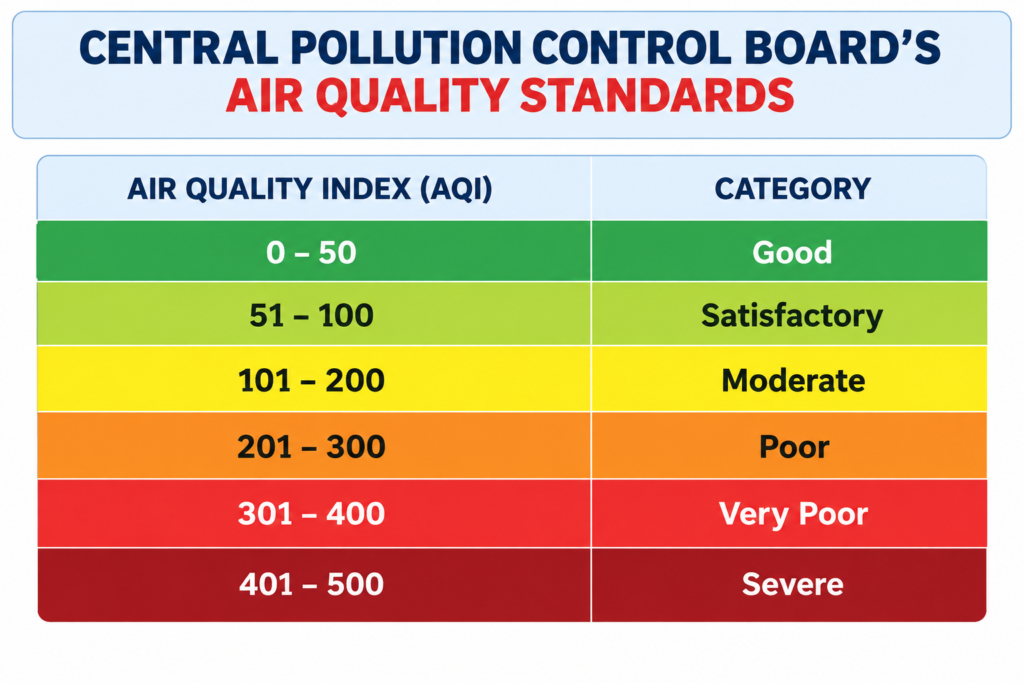
- The 6 Air Quality Categories: The numerical score maps directly to six distinct color-coded health categories:
- Good
- Satisfactory
- Moderately Polluted
- Poor
- Very Poor
- Severe
Statutory and Institutional Mechanisms for Air Pollution Abatement – UPSC Agriculture Optional
Addressing atmospheric degradation requires a combination of strict legislative frameworks, national monitoring strategies, public welfare interventions, and technological innovations. For a UPSC Agriculture Optional candidate, analyzing these institutional networks is crucial to understanding how the state protects regional microclimates and preserves biological productivity.
1. Statutory Pillars: National Environmental Legislations
India’s environmental governance is anchored by landmark central acts that grant monitoring, regulatory, and punitive powers to specialized statutory bodies.
The Air (Prevention and Control of Pollution) Act, 1981
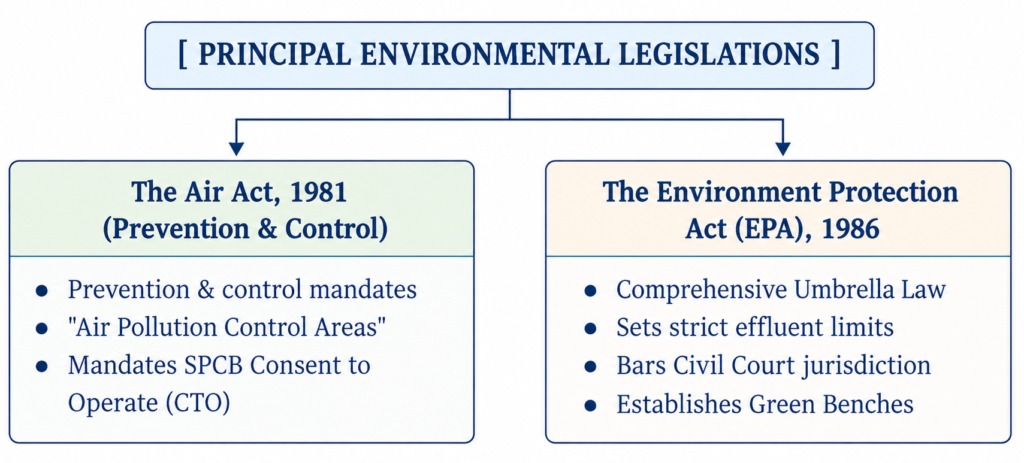
- Core Mandate: Focuses on the prevention, control, and abatement of atmospheric contaminants by setting ambient air quality standards and establishing centralized and state-level enforcement boards.
- Zoning Control Mechanism: Empowers state governments, in consultation with State Pollution Control Boards (SPCBs), to designate specific regions as Air Pollution Control Areas. Within these zones, the use of highly polluting fuels or obsolete appliances is completely prohibited.
- Consent Architecture: Makes it legally mandatory for any industrial or agro-processing plant operating within a designated control area to obtain a formal Consent to Operate (CTO) from the respective SPCB.
The Environment Protection Act (EPA), 1986
- Umbrella Architecture: Serves as a comprehensive framework coordinating activities under previous laws, including the Water Act (1974) and the Air Act (1981).
- Centralized Regulatory Powers: Grants the Central Government broad authority to set national emission thresholds, regulate industrial locations, manage hazardous waste streams, and authorize regulatory personnel to inspect and collect field samples.
- Judicial Overhaul: Proscribes the jurisdiction of standard Civil Courts over environmental conflicts. It requires states to set up dedicated Green Bench Courts to handle Public Interest Litigations (PILs) regarding environmental issues.
2. Institutional Frameworks: CPCB
Central Pollution Control Board (CPCB)
- Statutory Genesis: Established in 1974 under the Water (Prevention and Control of Pollution) Act, 1974. It subsequently derived additional investigative and enforcement powers from the Air Act, 1981.
- Functional Imperatives: Acts as the apex national body for pollution control, advising the Central Government on environmental policies.
- Data and Research Management: Coordinates state-level board operations, conducts advanced ecological impact research, and manages nationwide monitoring networks under the National Air Quality Monitoring Programme (NAMP).
3. Targeted National Frameworks and Policy Interventions
National Clean Air Programme (NCAP)
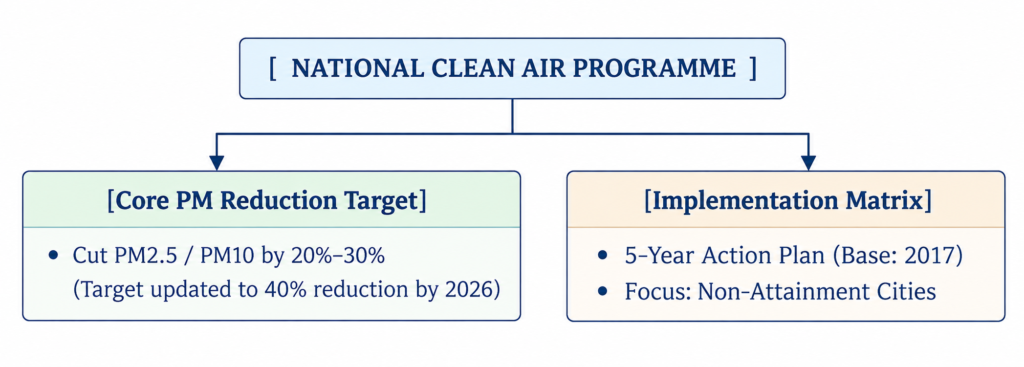
Launched by the Ministry of Environment, Forest and Climate Change (MoEFCC) in January 2019, NCAP provides a time-bound management framework to combat air pollution across the country.
- The Non-Attainment Framework: Targets non-attainment cities—urban clusters that consistently fail to meet national ambient air quality standards. For each identified city, customized local mitigation blueprints are executed.
- The Dynamic Target Vector: Originally designed to achieve a 20% to 30% reduction in PM2.5 and PM10 concentrations by 2024 using 2017 as the baseline year.
- UPSC Note (Temporal Update): The central government subsequently revised the NCAP objective, setting a stricter target of a 40% reduction in particulate matter concentrations by 2026 for targeted cities.
- Multilateral Oversight: Features tiered, multi-level governance structures, including national Project Monitoring Units, state-level implementation bodies, and district-level verification teams headed by District Magistrates (DMs).
Pradhan Mantri Ujjwala Yojana (PMUY)
Launched in 2016 under the Ministry of Petroleum and Natural Gas, PMUY plays a crucial role in reducing rural air pollution.
- Agrarian Microclimate Impact: Provides deposit-free Liquefied Petroleum Gas (LPG) connections to Below Poverty Line (BPL) households. By replacing traditional biomass fuels (dung cakes, crop residues, firewood), PMUY directly lowers indoor air pollution, protects rural health, and reduces the carbon footprint in agricultural communities.
4. Technological Monitoring and Purifying Innovations
Modern environmental management increasingly relies on real-time forecasting models and localized filtration technologies.
SAFAR (System of Air Quality and Weather Forecasting And Research)
- Institutional Genesis: An indigenous initiative developed by the Indian Institute of Tropical Meteorology (IITM), Pune, and operationalized by the India Meteorological Department (IMD) under the Ministry of Earth Sciences.
- Analytical Output: Provides real-time, location-specific Air Quality Index (AQI) values alongside 72-hour advance early warning forecasts. It records vital meteorological parameters like temperature, solar radiation intensity, UV indices, rainfall, and wind vector kinetics.
WAYU (Wind Augmentation PurifYing Unit)
- Engineering Design: An air purification device indigenously developed by the CSIR-National Environmental Engineering Research Institute (CSIR-NEERI).
- Target Deployment: Specifically engineered to mitigate high particulate loads at dense traffic intersections and congested urban zones. It utilizes active wind-augmentation systems alongside localized filtration grids, purifying ambient air across an operational footprint of 500 square meters.
Water Pollution and Associated Hazards in Agrarian Ecosystems – UPSC Agriculture Optional
In crop ecology and environmental hydrology, water pollution is defined as the anthropogenic introduction of undesirable chemical, biological, physical, or radiological substances into aquatic systems, breaching their ecological carrying capacities.
As India urbanises, its hydrological networks face severe toxic stress. Data from NITI Aayog indicates that nearly 70% of surface water in India is unfit for human consumption. Every day, approximately 40 million litres of wastewater flow into rivers and lakes, with only a fraction undergoing adequate treatment.
1. Macro-Economic and Agrarian Imperatives
The deterioration of water quality introduces severe economic and yield barriers downstream:
- The Downstream GDP Drag: A World Bank report reveals that upstream pollution discharges significantly limit downstream economic expansion. In middle-income nations like India, upstream pollution can cause a loss of up to half of downstream GDP growth.
- Agricultural Revenue and Yield Demise: Empirical studies estimate that being located downstream of polluted river stretches in India is associated with a 9% reduction in agricultural revenues and a 16% drop in downstream crop yields, establishing water pollution as a direct threat to food security.
2. Classification of Water Pollution Sources
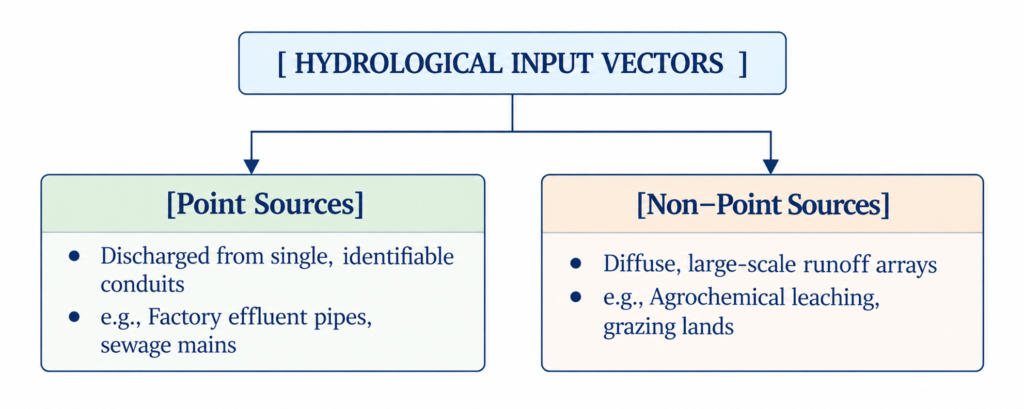
I. Point Sources
Pollutants enter the aquatic system through a single, distinct, and identifiable conduit or structural point.
- Examples: Industrial effluent drain pipes from chemical units or municipal sewage outfalls discharging directly into a river course.
II. Non-Point Sources
Pollutants originate from diffuse, expansive geographic areas rather than a single point of discharge.
- Examples: Surface runoff from agricultural fields carrying excess fertilizers and pesticides, sediment runoff from construction zones, and wash-off from livestock grazing lands. These are highly complex to monitor and regulate.
3. Structural Analysis of Pollution Vectors
Agricultural Drivers (The Agrochemical Cascade)
Modern intensive farming relies heavily on synthetic inputs, which can escape the farm boundary through two main pathways:
- Surface Runoff: Carrying dissolved salts like nitrates, phosphates, ammonia, and pesticide residues into surface water bodies, triggering eutrophication (nutrient enrichment leading to algal blooms).
- Sub-surface Leaching: Gravity-driven drainage forces soluble nutrients and toxic metal ions past the root zone into unconfined aquifers, contaminating groundwater.
- The Pesticide Profile: Agrochemical arrays include insecticides, fungicides, and herbicides. Many contain persistent chlorinated hydrocarbons (CHCs) like DDT and Endosulfan, which resist environmental degradation.
Bioaccumulation vs. Biomagnification
- Bioaccumulation: The process where a chemical pollutant is directly absorbed and incorporated into the tissues of an individual aquatic organism at a rate faster than it can be metabolized or excreted.
- Biomagnification: The progressive increase in the concentration of a non-degradable, lipophilic toxin at sequential higher trophic levels of the food chain.

Domestic Sewage and Industrial Effluents
- Domestic Sewage: Contains human and animal excreta, food residues, synthetic cleaning agents, and pathogenic microorganisms (bacteria, viruses) that cause waterborne epidemics.
- Industrial Effluents: Discharges from petroleum refineries, paper mills, and chemical plants introduce toxic organic compounds and heavy metals (elements with a density 5 g/cm3 such as Mercury (Hg), Cadmium (Cd), Copper (Cu), Lead (Pb), and Arsenic (As).
4. Key Biochemical Water Quality Indices
The presence of organic and inorganic waste shifts the chemical balance of water, which can be measured using two core indicators:
I. Dissolved Oxygen (DO)
DO represents the volume of free, non-compound oxygen dissolved in an aquatic environment, which is vital for the respiration of aerobic organisms.
- Contaminated Threshold: Water with a DO content below 8.0 mg/L is considered contaminated.
- Highly Polluted Threshold: Water with a DO content below 4.0 mg/L is classified as highly polluted. This critical drop leads to mass fish mortality.
- Determinant Dynamics: DO levels are regulated by surface turbulence, photosynthetic output of aquatic flora, and oxygen consumption by decomposers. High organic waste inputs accelerate microbial decomposition, rapidly depleting available DO.
II. Biochemical Oxygen Demand (BOD)
BOD is a measure of the organic pollution load in a water body. It represents the amount of dissolved oxygen required by aerobic bacteria to stabilize and decompose the organic biodegradable waste present in a litre of water.
- The Inverse Relationship: A higher BOD value indicates a heavy organic pollution load, which corresponds to critically low DO content, suffocating higher aquatic life.
5. Thermal and Radiological Degradation
Thermal Pollution
Industrial manufacturing units and thermal/nuclear power stations draw ambient water for cooling, returning the used, high-temperature water back into natural streams.
- The Thermal Jump: This discharge can raise local water temperatures by 10°C to 15°C above baseline ambient levels.
- Physiological Impact on Aquatic Biota: Rising water temperatures directly decrease oxygen solubility. A slight thermal shift affects aquatic organisms by disrupting fish feeding models, retarding growth rates, reducing swimming efficiency, lowering resistance to diseases/parasites, and reducing overall aquatic biodiversity.
Radiation Contamination
Nuclear industrial accidents or natural disasters damaging coastal installations (e.g., the Fukushima Daiichi nuclear disaster) can release radioactive isotopes into water bodies.
- Pathological Fallout: Isotopes like Radioactive Iodine are rapidly absorbed by the human thyroid gland, where they emit ionizing radiation that can cause thyroid cancer.
6. Groundwater Contamination Hazards
In India, subterranean aquifers are increasingly threatened by agricultural leaching, municipal waste seepage, and industrial mine discharges.
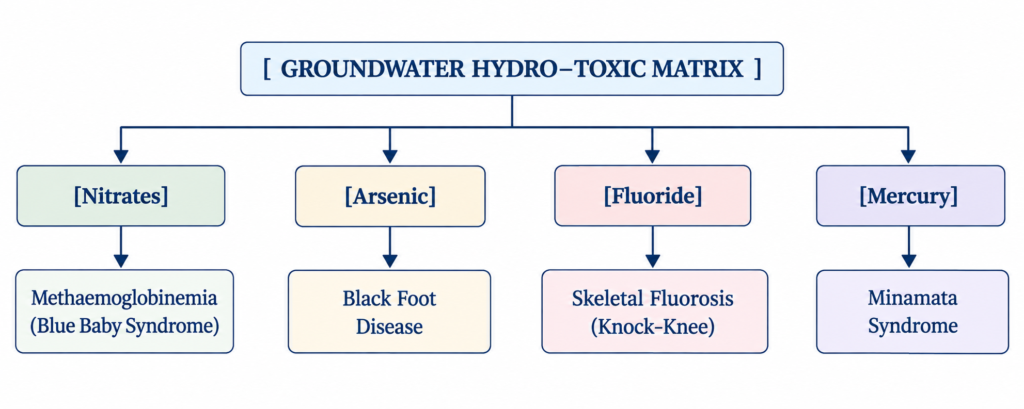
I. Nitrates (NO3–)
- Source: Leaching of synthetic nitrogen fertilizers (urea) and animal waste.
- Pathology: Excess nitrate in drinking water is converted to nitrite in the digestive tract. This nitrite reacts with blood hemoglobin to form methaemoglobin, a non-functional variant incapable of binding oxygen. This impairs oxygen transport, causing cellular asphyxiation known as Methaemoglobinemia or Blue Baby Syndrome.
II. Arsenic (As)
- Source: Seepage from industrial chemical plants, mining discharges, and fly-ash ponds of thermal power stations, particularly prevalent in the Ganges Delta (West Bengal and Bangladesh).
- Pathology: Chronic exposure blocks essential cellular enzyme systems, causing Black Foot Disease (a severe peripheral vascular disease leading to gangrene), chronic diarrhea, and increased risks of skin, lung, and bladder cancers.
III. Fluoride (F–)
- Source: Geogenic leaching of fluoride-bearing minerals, accelerated by over-extraction of groundwater.
- Pathology: Chronic ingestion triggers neuromuscular disorders, gastrointestinal irritation, and dental fluorosis. Severe cases lead to skeletal fluorosis, characterized by bone hardening, calcification of ligaments, and painful, stiff joints. The outward bending of legs from the knee joints is known as Knock-Knee Syndrome.
IV. Mercury (Hg) and Lead (Pb)
- Source: Industrial electronic waste, chemical factories, and metallurgical smelting units.
- Pathology: Anaerobic bacteria in aquatic sediments convert inorganic mercury into highly toxic, lipophilic Methylmercury This compound bio-magnifies up the food chain, causing Minamata Disease in humans—a severe neurological syndrome marked by loss of motor control, mental derangement, and death. Lead ingestion causes systemic poisoning, interfering with red blood cell synthesis and damaging the central nervous system.
Ecological Dynamics and Remediation of Water Pollution – UPSC Agriculture Optional
In agricultural ecology and aquatic resource management, the impacts of water pollution must be systematically evaluated based on their disruption of trophic webs, shifts in community structure, and applied bioremediation solutions. For an Agriculture Optional student, these interactions illustrate how chemical inputs escape farm boundaries and cause widespread ecological changes downstream.
1. Biophysical and Multi-Trophic Environmental Impacts
When toxic or nutrient-rich compounds enter aquatic ecosystems, they trigger systemic imbalances that disrupt biological cycles across multiple species.
Accelerated Eutrophication and Cultural Aging of Lakes
- Mechanics: The discharge of agricultural runoff rich in nitrates and phosphates creates a nutrient surplus in water bodies. This triggers an algal bloom—the rapid, uncontrolled proliferation of planktonic algae.
- Ecological Fallout: As these massive algal mats die, heterotrophic bacteria decompose the organic matter, consuming vast amounts of oxygen. This accelerates the cultural eutrophication (ecological aging) of lakes, transforming clean, oxygen-rich aquatic environments into shallow, anaerobic marshes.
Biomagnification and Avian Calcium Disruption
- Mechanics: Persistent, fat-soluble toxins (such as Methylmercury and organochlorine pesticides like DDT) resist biological degradation. Instead of being excreted, they undergo biological magnification (biomagnification), concentrating exponentially as they move up the food chain.
- Avian Pathology: In apex avian predators (e.g., fish-eating eagles, piscivorous birds), high accumulated concentrations of DDT disrupt calcium metabolism by inhibiting the enzyme calcium adenosine triphosphatase in the shell gland. This leads to severe eggshell thinning, causing eggs to break prematurely during incubation and driving down regional bird populations.

2. Impacts on Aquatic Ecosystems and Bio-Indicators
Pollution pressures alter the distribution and diversity of aquatic communities by creating severe physiological stress.
- Elimination of Sensitive Taxa: Highly polluted waters experience a sharp drop in Dissolved Oxygen (DO). This localized hypoxia quickly eliminates sensitive stenoxic organisms, including essential plankton, structural molluscs, and major commercial fish species.
- Resilience of Indicator Species: While sensitive organisms decline, a few highly pollution-tolerant macro-invertebrates thrive in low-DO conditions. Annelid worms like Tubifex tubifex (sludge worm) and certain chironomid insect larvae flourish in highly organic, oxygen-depleted waters. Consequently, the presence of dominant Tubifex populations serves as a reliable biological indicator of severe organic pollution.
- Chemical Toxins and Thermal Stress: Complex compounds like Polychlorinated Biphenyls (PCBs), synthetic biocides, and heavy metals cause direct mortality in aquatic life by disrupting cell membranes and blocking enzyme pathways. Additionally, hot water discharges from industrial cooling loops lower oxygen solubility while elevating the metabolic rates of fish, compounding respiratory stress.
3. Agronomic and Bioremediation Strategies
Restoring polluted aquatic systems requires a combination of ecological engineering, sustainable farming practices, and biological filtration.
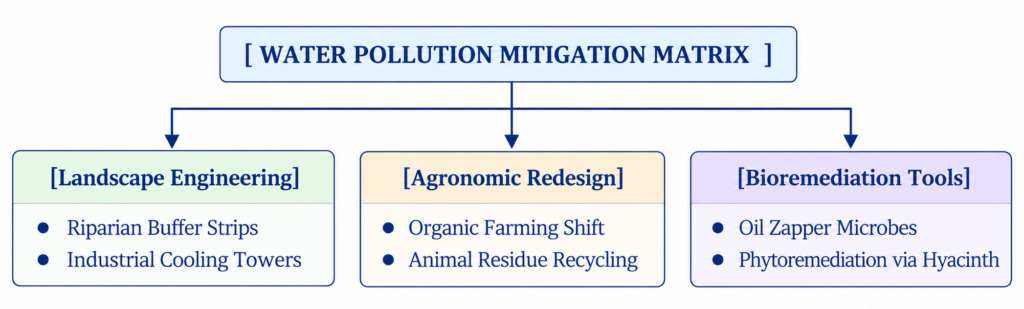
I. Landscape and Engineering Controls
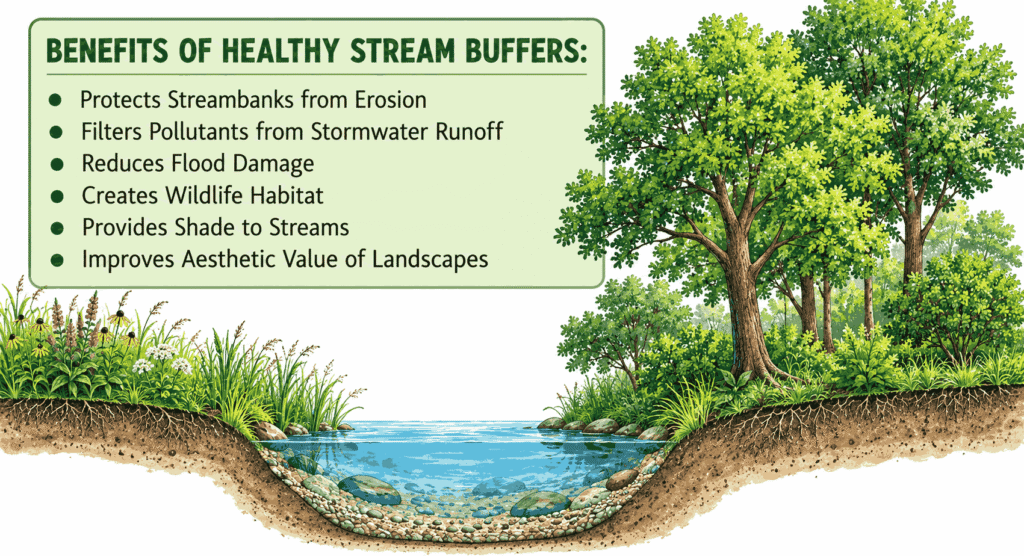
- Riparian Buffer Strips: Establishing managed, vegetated, or forested riparian buffers along the borders of agricultural streams. These biological strips intercept, absorb, and filter agrochemical residues from surface runoff before they enter open water networks. They also provide shade that lowers water temperatures and preserves ambient DO levels.
- Effluent Pre-treatment: Enforcing mandatory chemical and biological pre-treatment of municipal sewage and industrial waste. Industrial facilities must route hot wastewater through cooling towers or stabilization ponds to reduce its temperature to ambient levels before discharge.
II. Agronomic Redesign
- Input Optimization: Moving away from intensive chemical inputs toward integrated systems, including Organic Farming and Natural Farming templates.
- Nutrient Recycling: Replacing synthetic, highly soluble nitrogenous and phosphatic fertilizers with efficiently processed animal residues, green manuring, and bio-fertilizers. This strategy improves soil aggregate structure and reduces nutrient leaching.
III. Applied Bioremediation and Phytoremediation
- Phytoremediation via Hyper-accumulators: Utilizing Water Hyacinth (Eichhornia crassipes), an aggressive aquatic weed, as a controlled biological filter. This species acts as a potent hyper-accumulator, absorbing heavy metals (like Lead, Cadmium, and Arsenic) and organic toxins from contaminated wastewater streams.
- Microbial Clean-up (Oil Zapping): Deploying customized bacterial cocktails—such as Oil Zapper technology (developed by TERI)—to treat marine and coastal oil spills. These specialized microorganisms feed on crude oil hydrocarbons, breaking them down into harmless Carbon Dioxide and water.
- Rhizofiltration Barriers: Planting Eucalyptus trees along the perimeters of sewage treatment ponds. Eucalyptus displays high transpiration rates and acts as an efficient biological pump. It rapidly absorbs surplus wastewater through its extensive root network and releases clean water vapor into the atmosphere via transpiration, filtering out pollutants within the soil matrix.
Bioremediation and Statutory Frameworks for Water Pollution Control – UPSC Agriculture Optional
In agricultural engineering, environmental biotechnology, and water resource governance, reversing aquatic degradation requires a combination of modern biological engineering (bioremediation) and strict statutory command-and-control frameworks. For a UPSC Agriculture Optional candidate, these technologies represent the primary tools used to clean up agrochemical runoff, industrial toxins, and municipal wastes.
1. Advanced Core Bioremediation Methodologies
Bioremediation is the engineered application of microorganisms (primarily specialized bacteria and fungi) to metabolize, degrade, or transform hazardous environmental contaminants into non-toxic or less-toxic forms. These microorganisms can be deployed as native communities or enhanced via genetic engineering techniques to improve their enzymatic digestion efficiency.
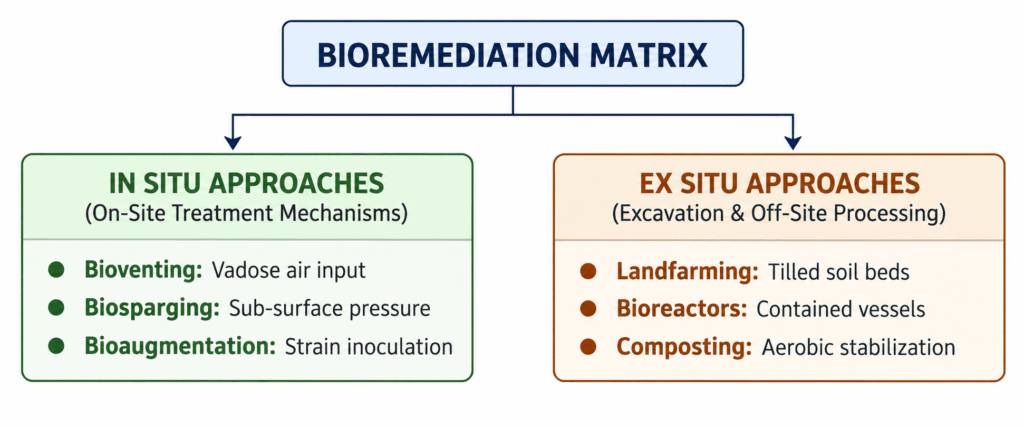
I. In Situ Bioremediation (On-Site Reclamation)
This approach involves treating contaminated matrices directly at the site without excavating the soil or pumping out the groundwater.
- Bioventing: The controlled injection of low-flow air and essential nutrients through specialized wells into the unsaturated (vadose) soil zone. This stimulates the metabolic activity of indigenous aerobic bacteria, accelerating the degradation of organic contaminants.
- Biosparging: The high-pressure injection of air below the water table to increase dissolved oxygen concentrations in the groundwater. This directly elevates the rate of biological degradation by naturally occurring microbes. It is a highly effective biological approach for removing volatile organic aromatics like Benzene, Toluene, Ethylbenzene, Xylene, and Naphthalene (BTEXN).
- Bioaugmentation: The intentional introduction of exogenous, specialized microbial strains to a contaminated site to complement or enhance the native microbial community’s degradation capacity.
- The TERI Innovations: Utilizing this technique, The Energy and Resources Institute (TERI) developed ‘Oilzapper’ and ‘Oilivorous-S’. Oilzapper is a customized cocktail of five distinct bacterial strains that feed on crude oil hydrocarbons. It cleans up oil-slicked soils and marine spills, leaving behind no harmful chemical residues.
II. Ex Situ Bioremediation (Off-Site Reclamation)
This approach requires excavating contaminated soil or pumping out water to be treated in an engineered containment facility elsewhere.
- Landfarming: Contaminated topsoil is excavated, transported, and spread over a prepared, lined treatment bed. The matrix is periodically tilled and aerated to stimulate indigenous biodegradative microbes, facilitating the aerobic degradation of contaminants.
- Bioreactors: An engineered containment system (such as a vessel or tank) used to process contaminated solid slurry (soil, sediment, sludge) or wastewater. This method maximizes microbial kinetics by allowing precise control over temperature, pH, aeration, and nutrient concentration.
- Composing: An aerobic process that combines contaminated organic matter with bulking agents (e.g., agricultural straw or wood chips). Thermophilic microorganisms stabilize and degrade organic toxins, transforming them into a rich, structured organic fertilizer known as compost.
III. Phytoremediation
The strategic use of living green plants to remove, transfer, stabilize, or destroy environmental contaminants in soil, groundwater, and surface water.
- Ecological Sinks: Natural phytoremediation is continuously carried out by mangroves, estuarine vegetation, and wetland ecosystems, which act as critical bio-filters that trap heavy metals and excess agrochemical nutrients from coastal runoff.
2. Constitutional and Statutory Pillars of Water Governance
India’s water pollution abatement legal architecture relies on distinct central acts that establish monitoring standards and regulate industrial discharges.
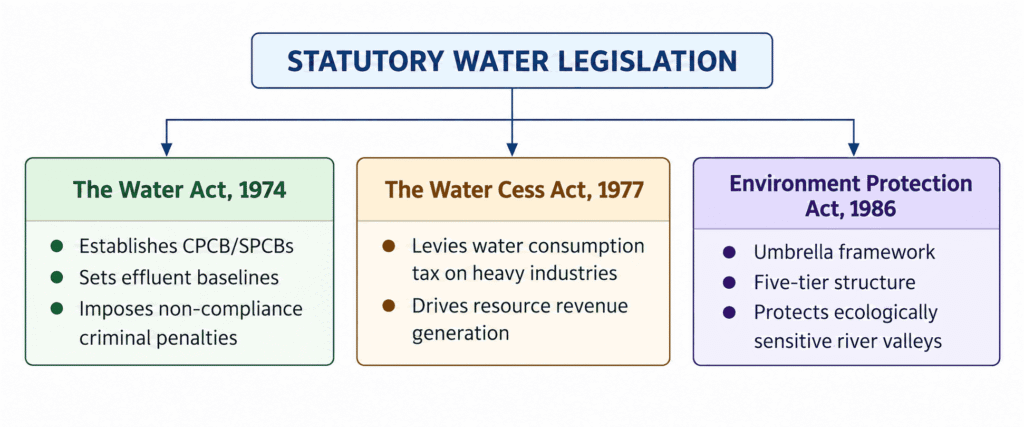
The Water (Prevention and Control of Pollution) Act, 1974
- Core Legal Objective: Focuses on maintaining and restoring the wholesomeness of national water networks by preventing and controlling pollution.
- Institutional Architecture: Established the Central Pollution Control Board (CPCB) and State Pollution Control Boards (SPCBs) as regulatory enforcement bodies.
- Enforcement Mandates: Prohibits the discharge of industrial or municipal effluents into aquatic bodies beyond permissible standards. It lays down strict penalties and criminal liabilities for non-compliance. CPCB sets the baseline national metrics, which are enforced locally by SPCBs.
The Water (Prevention and Control of Pollution) Cess Act, 1977
- Fiscal Purpose: Provides for the levy and collection of a dedicated cess (tax) on water consumed by entities operating specific, high-pollution industrial activities and municipal authorities.
- Revenue Generation: This acts as a revenue-generation tool to fund the operations and monitoring infrastructure of central and state pollution control boards.
3. Evolution of River Rejuvenation and Conservation Plans
Over the past few decades, India’s national river conservation strategies have transitioned from localized engineering interventions to comprehensive basin-scale programs.
I. The Historical Timeline
- Ganga Action Plan (GAP) – 1985: Launched as a targeted initiative for pollution abatement across identified polluted stretches of the Ganga. However, it faced limitations due to fragmented execution and a lack of municipal treatment coordination.
- National River Conservation Plan (NRCP) – 1995: A centrally sponsored plan managed by the Ministry of Jal Shakti. It expanded the river cleanup model to cover 38 major rivers across 178 towns in 20 States, focusing on intercepting, diverting, and treating domestic sewage via Sewage Treatment Plants (STPs).
- National Mission for Clean Ganga (NMCG) – 2011: Established as the financial and implementation arm of the National Ganga River Basin Authority (NGRBA) under the Environment (Protection) Act, 1986. In 2016, the NGRBA was dissolved and replaced by the apex National Ganga Council, which is chaired directly by the Prime Minister.
4. The Namami Gange Programme: An Integrated Paradigm Shift
Approved as a flagship integrated conservation mission by the Union Government in June 2014, the Namami Gange Programme operates under the Department of Water Resources, River Development, and Ganga Rejuvenation, Ministry of Jal Shakti. It features a centrally funded, non-lapsable corpus of ₹20,000 crores managed by the NMCG and its state counterparts (State Program Management Groups – SPMGs).
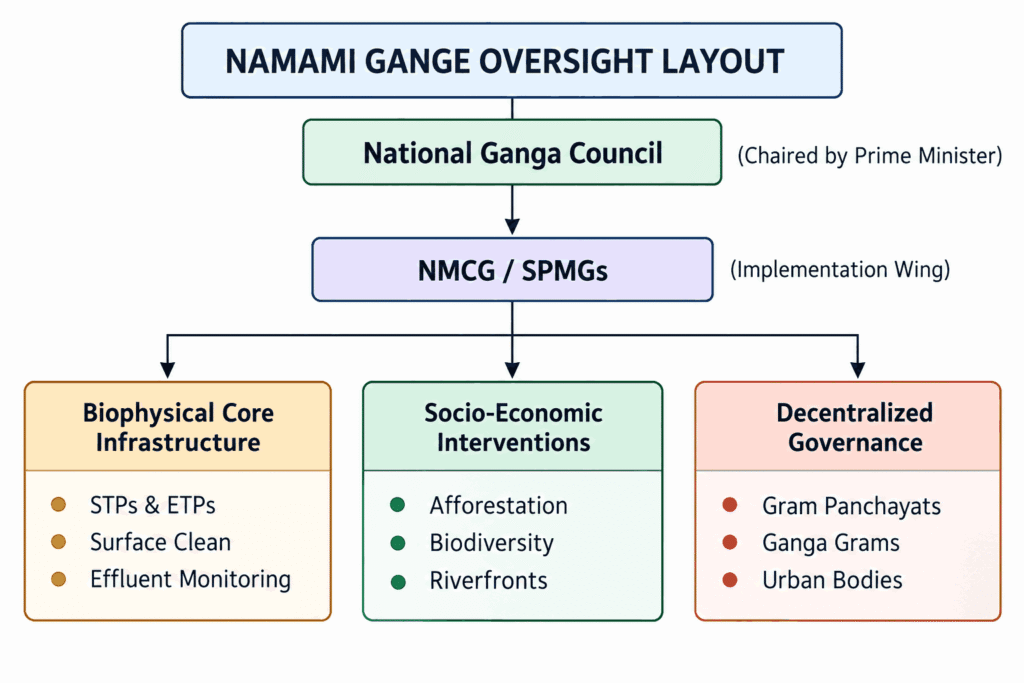
The Eight Core Pillars of Namami Gange
- Sewerage Treatment Infrastructure: Constructing and upgrading high-capacity municipal STPs to intercept and treat urban household waste.
- Industrial Effluent Monitoring: Enforcing real-time, online continuous emission monitoring systems (OCEMS) across highly polluting industries to ensure zero untreated industrial discharge.
- River-Surface Cleaning: Deploying automated trash skimmers to collect floating solid waste and plastic debris from open water surfaces.
- Biodiversity Conservation: Restoring native aquatic fauna, including the endangered Ganges River Dolphin (Platanista gangetica), smooth-coated otters, and endemic turtle species.
- Afforestation: Planting native, soil-binding, and water-retaining tree species along the riparian banks of the river course to reduce topsoil erosion and enhance groundwater recharge.
- River-Front Development: Constructing eco-friendly ghats and modern crematoria to systematically reduce the direct dumping of human remains and ceremonial waste.
- Public Awareness: Conducting large-scale community outreach, workshops, and exhibitions to drive behavioral change across civil society.
- Ganga Gram: Transforming villages located along the riverbanks into model sanitation units (Ganga Grams). This strategy focuses on building open-defecation-free (ODF) zones, implementing solid-liquid waste management, and encouraging organic farming practices.
The Governance Shift: Grassroots Integration
Namami Gange represents a major change in execution by shifting away from a purely top-down, engineering-centric approach. Sustainable, long-term results are achieved by actively involving local populations living along the riverbanks. The program leverages grassroots institutions—including Urban Local Bodies (ULBs) and Panchayati Raj Institutions (PRIs)—to manage assets on-site, ensuring community ownership over the river ecosystem.
Soil Pollution and Rhizospheric Degradation – UPSC Agriculture Optional
In agricultural ecology and edaphic science, soil pollution is defined as the anthropogenic accumulation of xenobiotic chemicals, toxic heavy metals, radioactive nuclides, and non-biodegradable solid wastes within the rhizosphere (root zone). This accumulation breaches the soil’s natural buffering capacity, alters its physical structure, disrupts microbial food webs, and poses a direct threat to food safety.